
I’ve spent the last week or so reworking the first draft of my universality article for Mathematics Awareness Month, in view of the useful comments and feedback received on that draft here on this blog, as well as elsewhere. In fact, I ended up rewriting the article from scratch, and expanding it substantially, in order to focus on a more engaging and less technical narrative. I found that I had to use a substantially different mindset than the one I am used to having for technical expository writing; indeed, the exercise reminded me more of my high school English assignments than of my professional work. (This is perhaps a bad sign: English was not exactly my strongest subject as a student.)
The piece now has title: “E pluribus unum: from complexity, universality”. This is a somewhat US-centric piece of wordplay, but Mathematics Awareness Month is, after all, a US-based initiative, even though awareness of mathematics certainly transcends national boundaries. Still, it is a trivial matter to modify the title later if a better proposal arises, and I am sure that if I send this text to be published, that the editors may have some suggestions in this regard.
By coincidence, I moved up and expanded the other US-centric item – the discussion of the 2008 US presidential elections – to the front of the paper to play the role of the hook. I’ll try to keep the Commonwealth spelling conventions, though. :-)
I decided to cut out the discussion of the N-body problem for various values of N, in part due to the confusion over the notion of a “solution”; there is a nice mathematical story there, but perhaps one that gets in the way of the main story of universality.
I have added a fair number of relevant images, though some of them will have to be changed in the final version for copyright reasons. The narrow column format of this blog means that the image placement is not optimal, but I am sure that this can be rectified if this article is published professionally.
— E pluribus unum: from complexity, universality —
A brief tour of the mysteriously universal laws of mathematics and nature.
Nature is a mutable cloud, which is always and never the same. (Ralph Waldo Emerson, “History“, from Essays: First Series, 1841)
1. Prologue: the 2008 US presidential election and the law of large numbers.
Do I contradict myself?
Very well then I contradict myself,
(I am large, I contain multitudes.)(Walt Whitman, “Song of myself“, 1855)
The US presidential elections of November 4, 2008 were a massively complicated affair. Over a hundred million voters from fifty states cast their ballot, with each voter’s decision being influenced in countless different ways by the campaign rhetoric, the media coverage, rumors, personal impressions of the candidates, or from discussing politics with friends and colleagues. There were millions of “swing” voters that were not firmly supporting either of the two major candidates; their final decision would be unpredictable, and perhaps even random in some cases. There was the same uncertainty at the state level: while many states were considered safe for one candidate or the other, at least a dozen states were considered “in play”, and could conceivably have gone either way.
In such a situation, it would seem impossible to be able to accurately forecast the election outcome in advance. Sure, there were electoral polls – hundreds of them – but each poll only surveyed a few hundred or a few thousand likely voters, which is only a tiny fraction of the entire population. And the polls often fluctuated wildly and disagreed with each other; not all polls were equally reliable or unbiased, and no two polling organisations used exactly the same methodology.
Nevertheless, well before election night was over, the polls had predicted the outcome of the presidential election, and most of the other elections taking place that night, quite accurately. Perhaps the most spectacular instance of this was the predictions of the statistician Nate Silver, who used a weighted analysis of all existing polls to correctly predict the outcome of the presidential election in 49 out of 50 states, as well as of all 35 of the 35 US senate races. (The lone exception was the presidential election in Indiana, which Silver called narrowly for McCain, but which eventually favoured Obama by just 0.9%.)

Fig 1. 2008 Presidential Election projections by Nate Silver on election night (Nov 4, 2008). (Source: Wikipedia)

Fig 2. Actual 2008 Presidential election results. (Source: the New York Times)
The theoretical basis for polling is a mathematical law known as the law of large numbers. Roughly speaking, this law asserts that if one is making a set of samples via some random method, then as one makes the sample size larger and larger, the average outcome of those samples will almost always converge to a single number, known as the expected outcome of that random method. For instance, if one flips a fair coin a thousand times, then one can use this law to show that the proportion of heads one gets from doing so will usually be quite close to the expected value of 50%; indeed, it will be within 3% of 50% (i.e. between 470 and 530 heads out of 1000) about 95% of the time.
In a very similar vein, if one selects a thousand voters at random and in an unbiased fashion (so that each voter is equally likely to be selected by the poll), and finds out who they would vote for (out of two choices, such as Obama and McCain; assume for simplicity that third-party votes are negligible), then the outcome of this poll has a margin of error of about 3% with a 95% confidence level, which means that 95% of the time that such a poll is conducted, the result of the poll will be within 3% of the true result of the election.
One of the remarkable things about the law of large numbers is that it is universal. Does the election involve a hundred thousand voters, or a hundred million voters? It doesn’t matter – the margin of error for the poll will still be 3%. Is it a state that favors McCain to Obama 55% to 45%, or Obama to McCain 60% to 40%? Again, it doesn’t matter – the margin of error for the poll will still be 3%. Is the state a homogeneous bloc of (say) affluent white urban voters, or is the state instead a mix of voters of all incomes, races, and backgrounds? It still doesn’t matter – the margin of error for the poll will still be 3%. And so on and so forth. The only factor which really makes a significant difference1 is the size of the poll; the larger the poll, the smaller the margin of error.

Fig 3. Margin of error for various poll sizes, at the 95% confidence level, assuming that the electorate is split 50%-50% between two candidates. The horizontal axis represents the outcome of the poll. The error distributions are examples of the normal distribution, that arises in the central limit theorem discussed below; indeed, the law of large numbers and the central limit theorem are closely related. (Source: Wikipedia)
In 2008, reliably accurate meta-polls were still something of a novelty. But they seem here to stay, particularly in high-profile elections in which hundreds of polls are conducted; expect to see more from them in the future.
2. Approaching normal: bell curves and other universal laws.
I know of scarcely anything so apt to impress the imagination as the wonderful form of cosmic order expressed by the “Law of Frequency of Error”. The law would have been personified by the Greeks and deified, if they had known of it. It reigns with serenity and in complete self-effacement, amidst the wildest confusion. The huger the mob, and the greater the apparent anarchy, the more perfect is its sway. It is the supreme law of Unreason. Whenever a large sample of chaotic elements are taken in hand and marshaled in the order of their magnitude, an unsuspected and most beautiful form of regularity proves to have been latent all along. (Sir Francis Galton, Natural Inheritance, 1889, describing what is now known as the central limit theorem.)
The law of large numbers is one of the simplest and best understood of the universal laws in mathematics and nature, but it is by no means the only one. Over the decades, many such universal laws have been found, that govern the behaviour of wide classes of complex systems, regardless of what the components of that system are, or even how they interact with each other. In this article we will have a quick tour of some of these remarkable laws.
After the law of large numbers, perhaps the next most fundamental example of a universal law is the central limit theorem. Roughly speaking, this theorem asserts that if one takes a statistic that is a combination of many independent and randomly fluctuating components, with no one component having a decisive influence on the whole, then that statistic will be approximately distributed according to a law called the normal distribution (or Gaussian distribution), and more popularly known as the bell curve; some examples of this mathematical curve already appeared above in Figure 3. The law is universal because it holds regardless of exactly how the individual components fluctuate, or how many components there are (although the accuracy of the law improves when the number of components increases); it can be seen2 in a staggeringly diverse range of statistics, from the incidence rate of accidents, to the variation of height, weight, or other vital statistics amongst a species, to the financial gains or losses caused by chance, to the velocities of the component particles of a physical system. The size, width, location, and even the units of measurement of the distribution varies from statistic to statistic, but the bell curve shape can be discerned in all cases. This convergence arises not because of any “low-level” or “microscopic” connection between such diverse phenomena as car crashes, human height, trading profits, or stellar velocities, but because in all of these cases the “high-level” or “macroscopic” structure is the same, namely a compound statistic formed from a combination of the small influences of many independent factors. This is the essence of universality: the macroscopic behaviour of a large, complex system can be almost totally independent of its microscopic structure.
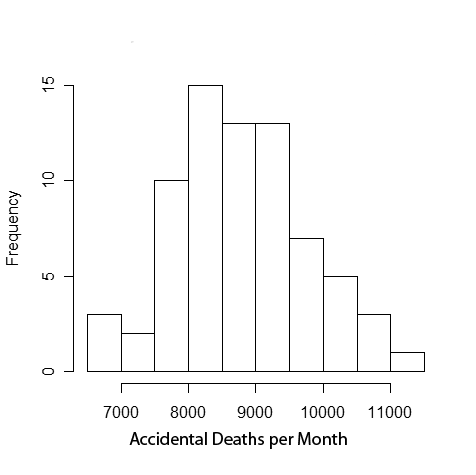
Fig 4. A histogram of monthly deaths from automobile statistics in the US from 1973 to 1978. (Source: Wikipedia)

Fig 5. A histogram of the height of 1,000 adult human males in inches. (Source: IBM) It is important here that we restrict to a single gender; we return to this point later in this article.

Fig 6. A histogram of daily profits or losses from the Citigroup's trading activities in 2007, excluding CDO activity (discussed at the end of this article). (Source: Financial Times)

Fig 7. A histogram of observed velocities (or more precisely, velocity dispersion inferred from redshift data) of stars in a single galaxy. (Source: Quarknet)
The universal nature of the central limit theorem is tremendously useful in many industries, allowing them to manage what would otherwise be an intractably complex and chaotic system. With this theorem, insurers can manage the risk of, say, their car insurance policies, without having to know all the complicated details of how car crashes actually occur; astronomers can measure the size and location of distant galaxies, without having to solve the complicated equations of celestial mechanics; electrical engineers can predict the effect of noise and interference on electronic communications, without having to know exactly how this noise was generated; and so forth. It is important to note, though that the central limit theorem is not completely universal; there are important cases when the theorem does not apply, giving statistics with a distribution quite different from the bell curve. I’ll return to this point later.
There are some other distant cousins of the central limit theorem that are universal laws for slightly different types of statistics. For instance, Benford’s law is a universal law for the first few digits of a large statistic, such as the population of a country or the size of an account; it gives a number of counterintuitive predictions, for instance that any given statistic occurring in nature is more than six times as likely to start with the digit 1, than with the digit 9. Among other things, this law (which can be explained by combining the central limit theorem with the mathematical theory of logarithms) has been used to detect accounting fraud, since numbers that are simply made up, as opposed to arising naturally in nature, often do not obey this law.

Fig 8. Histogram of the first digits of the population of the 237 countries of the world in 2010; the Benford's law prediction is given by the black dots. (Source: Wikipedia)

Fig 9. A histogram of the first two digits of accounts payable data of a major software company, together with the Benford's law prediction. (Source: Journal of Accountancy)
In a similar vein, Zipf’s law is a universal law that governs the largest statistics in a given category, such as the largest country populations in the world, or the most frequent words in the English language. It asserts that the size of a statistic is usually inversely proportional to its ranking; thus for instance the tenth largest statistic should be about half the size of the fifth largest statistic. (The law tends not to work so well for the top two or three statistics, but becomes more accurate after that.) Unlike the central limit theorem and Benford’s law, this law is primarily an empirical law; it is observed in practice, but mathematicians still do not have a fully satisfactory and convincing explanation for how the law comes about, and why it is so universal.

Fig 10. Histogram of the most frequently used words in "Moby Dick". (Source: searchengineland)

Fig 11. The most populous cities in the US Midwest in 2006. (Source: Federal Reserve Bank of Chicago)

Fig 12. The population of the most popular Massively Multiplayer Online Games (MMOG) in 2003. (Source: Raph Koster)
3. At the threshold: the universality of phase transitions
There is nothing so stable as change. (Bob Dylan, 1963. From “No Direction Home”, by Robert Shelton)
We’ve been discussing universal laws for individual statistics: complex numerical quantities that arise as the combination of many smaller and independent factors. But universal laws have also been found for more complicated objects than mere numerical statistics. One example of this is the laws governing the complicated shapes and structures that arise from phase transitions in physics and chemistry.
As we learn in high school science classes, matter comes in various states, including the three classic states of solid, liquid, and gas, but also a number of exotic states such as plasmas or superfluids. Ferromagnetic materials, such as iron, also have magnetised and non-magnetised states; other materials become electrical conductors at some temperatures and insulators at others. What state a given material is in depends on a number of factors, most notably the temperature and, in some cases, the pressure. (For some materials, the level of impurities is also relevant.) For a fixed value of the pressure, most materials tend to be in one state (e.g. a solid) for one range of temperatures, and in another state (e.g. a liquid) for another range. But when the material is at or very close to the temperature dividing these two ranges, interesting phase transitions occur, in which the material is not fully in one state or the other, but tends3 to split up into beautifully fractal shapes known as clusters, each of which embodies one or the other of the two states.
There are countless different materials in existence, each of which having a different set of key parameters (such as the boiling point at a given pressure). There are also a large number of different mathematical models that physicists and chemists use to model these materials and their phase transitions, in which individual atoms or molecues are assumed to be connected to some of their neighbours by a random number of bonds, assigned according to some probabilistic rule. At the microscopic level, these models can look quite different from each other. For instance, the figures below display the small-scale structure of two typical such models: a site percolation model on a hexagonal lattice, in which each hexagon (or site) is an abstraction of an atom or molecule randomly placed in one of two states, with the clusters being the connected regions of a single colour; and a bond percolation model on a square lattice, in which the edges of the lattice are abstractions of molecular bonds that each have some probability of being activated, with the clusters being the connected regions given by the active bonds.

Fig 13. Site percolation on the hexagonal lattice at the critical threshold. (Source: Michael Kozdron)

Fig 14. Bond percolation on the square lattice at the critical threshold. Each cluster has been coloured with a single colour to make them more visible. (Source: Christopher Myers).
If, however, one zooms out to a more macroscopic scale, and looks at the large-scale structure of clusters when one is at or near the critical value of parameters such as temperature, the differences in microscopic structure fade away, and one begins to see a number of universal laws emerging. While the clusters have a random size and shape, they almost always have a fractal structure, which roughly speaking means that if one zooms in a little on any portion of the cluster, the resulting image resembles the cluster as a whole. Basic statistics such as the number of clusters, the average size of the clusters, or how often a cluster connects two given regions of space, appear to obey some specific universal laws, known as power laws (which are somewhat similar, though not quite the same, as Zipf’s law, which was mentioned earlier). These laws seem to arise in almost every mathematical model that has been put forward to explain (continuous) phase transitions), and have also been observed many times in nature. As with other universal laws, the precise microscopic structure of the model or the material may affect some basic parameters, such as the phase transition temperature, but the underlying structure of the law is the same across all such models and materials.

Fig 15. Transition of vanadium dioxide from an insulator (blue) to conductor (green) at the critical temperature. (Source: Los Alamos National Laboratories.)

Fig 16. A simulation of the Ising model (a model for ferromagnetic phase transitions) at the critical temperature. (Source: Paul Coddington)

Fig 17. A percolation cluster occurring just below the critical threshold. (Source: Wikipedia)
In contrast to more classical universal laws such as the central limit theorem, our understanding of the universal laws of phase transition are still incomplete. Physicists have put forward some compelling heuristic arguments that explain or support many of these laws (based on a powerful, but not fully rigorous, tool known as the renormalisation group method), but a completely rigorous proof of these laws has not yet been obtained in all cases. This is very much a current area of research; for instance, in August of 2010 a Fields medal (one of the most prestigious prizes in mathematics) was awarded to Stanislav Smirnov for his breakthroughs in rigorously establishing the validity of these universal laws for some key models (such as percolation models on a triangular lattice).
4. Nuclear resonance and the music of the primes: the universality of spectra
Even without Hollywood hyperbole, however, the chance encounter of Montgomery and Dyson was a genuinely dramatic moment. Their conversation revealed an unsuspected connection between areas of mathematics and physics that had seemed remote. Why should the same equation describe both the structure of an atomic nucleus and a sequence at the heart of number theory? And what do random matrices have to do with either of those realms? In recent years, the plot has thickened further, as random matrices have turned up in other unlikely places, such as games of solitaire, one-dimensional gases and chaotic quantum systems. Is it all just a cosmic coincidence, or is there something going on behind the scenes? (Brian Hayes, “The spectrum of Riemannium“, American Scientist, 2003).
We are nearing the end of our tour of universal laws, and I’ll now turn to another example of this phenomenon which is closer to my own area of research. Here, the object of study is not a single numerical statistic (as was the case of the central limit theorem) or a shape (as was the case for phase transitions), but a discrete spectrum: a sequence of points (or numbers, or frequencies, or energy levels) spread out along a line.
Perhaps the most familiar example of a discrete spectrum is the radio frequencies emitted by local radio stations; this is a sequence of frequencies in the radio portion of the electromagnetic spectrum, which one can of course access by turning a radio dial. These frequencies are not evenly spaced, but usually some effort is made to keep any two station frequencies separated from each other, to reduce interference.
Another familiar example of a discrete spectrum is the spectral lines of an atomic element that come from the frequencies that the electrons in the atomic shells can absorb and emit, according to the laws of quantum mechanics. When these frequencies lie in the visible portion of the electromagnetic spectrum, they give individual elements their distinctive colour, from the blue light of argon gas (which, confusingly, is often used in neon lamps, as pure neon emits orange-red light) to the yellow light of sodium. For simple elements, such as hydrogen, the equations of quantum mechanics can be solved relatively easily, and the spectral lines follow a regular pattern; but for heavier elements, the spectral lines become quite complicated, and not easy to work out just from first principles.

Fig 18. Atomic spectral emission lines for various elements. (Source: Stephen Lower)

Fig 19. Scattering cross-section of neutron scattering for the Gadolinium-156 nucleus at various energy levels. (Roughly speaking, the scattering cross-section determines how likely the neutron is to bounce off the nucleus.) The scattering resonances (indicated by arrows) correspond to peaks in the cross-section. (Source: Coceva and Stefanon, Nuclear Physics A, 1979)
These resonances have an interesting distribution; they are not independent of each other, but instead seem to obey a precise repulsion law that makes it quite unlikely that two adjacent resonances are too close to each other, somewhat in analogy to how radio station frequencies tend to avoid being too close together, except that the former phenomenon arises from the laws of nature rather than from government regulation of the spectrum. In the 1950s, the renowned physicist and Nobel laureate Eugene Wigner investigated these resonance statistics and proposed a remarkable mathematical model to explain them, an example of what we now call a random matrix model. The precise mathematical details of these models are too technical to describe here, but roughly speaking one can view such models as a large collection of masses, all connected to each other by springs of various randomly selected strengths. Such a mechanical system will oscillate (or resonate) at a certain set of frequencies; and the Wigner hypothesis asserts that the resonances of a large atomic nucleus should resemble that of the resonances of such a random matrix model. In particular, they should experience the same repulsion phenomenon. Since it is possible to rigorously prove repulsion of the frequencies of a random matrix model, this gives a heuristic explanation for the same phenomenon that is experimentally observed for nuclei.

Fig 20. Spacing distribution for the resonances of various heavy nuclei, compared with the random matrix theory prediction. The repulsion effect is manifested in the relative scarcity of small spacings. (Source: Rosenzweig-Porter, Phys. Rev. 120 (1960))
Now, of course, an atomic nucleus does not actually resemble a large system of masses and springs (among other things, it is governed by the laws of quantum mechanics rather than of classical mechanics). Instead, as we have since discovered, Wigner’s hypothesis is a manifestation of a universal law that govern many types of spectral lines, including those that ostensibly have little in common with atomic nuclei or random matrix models. For instance, the same spacing distribution has been found in the waiting times between buses arriving at a bus stop:

Fig 21. A histogram of spacings between bus arrival times in Cuernavaca (Mexico), in crosses; the solid line is the prediction from random matrix theory. (Source: Krbalek-Seba, J. Phys. A., 2000)

Fig 22. Spacing distribution for a billion zeroes of the Riemann zeta function, and the corresponding prediction from random matrix theory. (Source: Andrew Odlyzko, Contemp. Math. 2001)
The discovery of the GUE hypothesis, connecting the music of the primes and the energy levels of nuclei, occurred at the Institute of Advanced Study in 1972, and the story is legendary in mathematical circles. It concerns a chance meeting between the mathematician Hugh Montgomery, who had been working on the distribution of zeroes of the zeta function (and more specifically, on a certain statistic relating to that distribution known as the pair correlation function), and the renowned physicist Freeman Dyson. To tell the story, I will quote from Dan Rockmore’s book “Stalking the Riemann hypothesis”:
As Dyson recalls it, he and Montgomery had crossed paths from time to time at the Institute nursery4 when picking up and dropping off their children. Nevertheless, they had not been formally introduced. In spite of Dyson’s fame, Montgomery hadn’t seen any purpose in meeting him. “What will we talk about?” is what Montgomery purportedly said when brought to tea. Nevertheless, Montgomery relented and upon being introduced, the amiable physicist asked the young number theorist about his work. Montgomery began to explain his recent results on the pair correlation, and Dyson stopped him short – “Did you get this?” he asked, writing down a particular mathematical formula. Montgomery almost fell over in surprise: Dyson had written down the sinc-infused pair correlation function. … Whereas Montgomery had traveled a number theorist’s road to a “prime picture” of the pair correlation, Dyson had arrived at this formula through the study of these energy levels in the mathematics of matrices…
The chance discovery by Montgomery and Dyson that the same universal law that governs random matrices and atomic spectra, also applies to the zeta function, was given substantial numerical support by the computational work of Andrew Odlyzko from the 1980s onwards (see Figure 22). But this does not mean that the primes are somehow nuclear-powered, or that atomic physics is somehow driven by the prime numbers; instead, it is evidence that a single law for spectra is so universal that it is the natural end product of any number of different processes, whether it comes from nuclear physics, random matrix models, or number theory.
The precise mechanism underlying this law has not yet been fully unearthed; in particular, we still do not have a compelling explanation, let alone a rigorous proof, of why the zeroes of the zeta function are subject to the GUE hypothesis. However, there is now a substantial body of rigorous work (including some by myself, and including some substantial breakthroughs in just the last one or two years) that gives support to the universality of this hypothesis, by showing that a wide variety of random matrix models (not just the most famous model of the Gaussian Unitary Ensemble) are all governed by essentially the same law for their spacings. At present, these demonstrations of universality have not extended to the number theoretic or physical settings, but they do give indirect support to the law being applicable in those cases.
The arguments used in this recent work are too technical to give here, but I will just mention one of the key ideas, which my co-author, Van Vu, and I borrowed from an old proof of the central limit theorem by Jarl Lindeberg in 1922. In terms of the mechanical analogy of a system of masses and springs mentioned earlier, the key strategy was to replace just one of the springs by another, randomly selected, spring, and show that the distribution of the frequencies of this system did not change significantly when doing so. Applying this replacement operation to each spring in turn, one can eventually replace a given random matrix model with a completely different model while keeping the distribution mostly unchanged, and this can be used to show that large classes of random matrix models have essentially the same distribution.
This is currently a very active area of research; for instance, simultaneously with my work with Van Vu last year, Laszlo Erdos, Benjamin Schlein, and Horng-Tzer Yau have also given a number of other demonstrations of universality for random matrix models, based on ideas from mathematical physics. The field is moving quickly, and in a few years we may have many more insights as to the nature of this still-mysterious universal law.
5. When universality fails: the complex middle ground
The universe is change; our life is what our thoughts make it. (Marcus Aurelius Antonius, Meditations)
There are many, many other universal laws of mathematics and nature out there; the examples given above are only a small fraction of those that have been discovered over the years, from such diverse subjects as dynamical systems and quantum field theory. For instance, many of the “macroscopic” laws of physics, such as the laws of thermodynamics or the equations of fluid motion, are quite universal in nature, with the microscopic structure of the material or fluid being studied being almost completely irrelevant, other than via some key parameters such as viscosity, compressibility, or entropy.
However, the principle of universality does have definite limitations. Take for instance the central limit theorem, which gives a bell curve distribution to any quantity that arises from a combination of many small and independent factors. This theorem can fail when the required hypotheses are not met. For instance, the distribution of the heights of all human adults (male and female) does not obey a bell curve distribution, because one single factor – gender – makes so much of an impact on height that it is not averaged out by all the other environmental and genetic factors that influence this statistic.

Fig 23. A "living histogram" of 143 students at the University of Connecticut, with females in white and males in black. (Source: The Hartford Courant, “Reaching New Heights,” November 23, 1996) Compare this non-bell-shaped distribution with Figure 5.
Another very important way in which the central limit fails is when the individual factors that make up a quantity do not fluctuate independently of each other, but are instead correlated, so that they tend to rise or fall in unison. In such cases, “fat tails” or “black swans” can develop, in which the quantity moves much further from its average value than the central limit theorem would predict. This phenomenon is particularly important in financial modeling, especially when dealing with complex financial instruments such as the collateralised debt obligations (CDOs) that were formed by aggregating several mortgages together. As long as the mortgages behaved independently of each other, the central limit theorem could be used to model the risk of these instruments; but in the recent financial crisis, this independence hypothesis broke down spectacularly, leading to significant financial losses for many holders of these obligations (and for their insurers). A mathematical model is only as strong as the assumptions behind it.

Fig 24. A histogram of returns for individual stocks, when compared against the Russell 3000 average. Note the fat tails and the large number of extreme deviations from the mean. (Source: seekingalpha)

Fig 25. The trajectory of the ARTEMIS-P1 Earth-Moon orbiter. The gravitational effects of the earth, moon, and sun combine to create an orbit which is chaotic, despite the relatively low number of degrees of freedom. The transition between the L1 and L2 orbits are powered, but the L1 and L2 orbits themselves are unpowered. (Source: NASA)
Another instance where the universal laws of fluid mechanics break down is at the mesoscopic scale – larger than the microscopic scale of individual molecues, but smaller than the macroscopic scales for which universality applies. An important example of a mesoscopic fluid is the blood flowing through blood vessels; the blood cells that make up this liquid are so large that they cannot be treated merely as an ensemble of microscopic molecues, but as mesoscopic agents with complex behaviour. Other examples of materials with interesting mesoscopic behaviour include colloidal fluids (such as mud), and certain types of nanomaterials; it is a continuing challenge to mathematically model such materials properly.

Fig 26. Red blood cells in an arteriole. (Source: P.M. Motter and S. Correr, Science Photo Library)
There are also many macroscopic situations in which no universal law is known to exist, particularly in cases where the system contains human agents. The stock market is a good example: despite extremely intensive efforts, no satisfactory universal laws to describe the movement of stock prices have been discovered (the central limit theorem, for instance, does not seem to be a good model, as discussed earlier). One reason for this, of course, is that any regularity in the market that is discovered, is likely to be exploited by arbitrageurs until it disappears. For similar reasons, finding universal laws for macroeconomics appears to be a moving target; according to Goodhart’s law, if an observed statistical regularity in economic data is exploited for policy purposes, it tends to collapse. (Ironically, Goodhart’s law is itself arguably an example of a universal law…)
Even when universal laws do exist, it may still be practically impossible to use them to predict what happens next. For instance, we have universal laws for the motion of fluids, such as the Navier-Stokes equations, and these are certainly used all the time in such tasks as weather prediction, but these equations are so complex and unstable that even with the most powerful computers, we are still unable to accurately predict the weather more than a week or two into the future.
In conclusion, we see that between the vast, macroscopic systems for which universal laws hold sway, and the simple systems that can be analysed using the fundamental laws of nature, there is a substantial middle ground of systems that are too complex for fundamental analysis, but too simple to be universal. Plenty of room, in short, for all the complexities of life as we know it.
6. Further reading
- Percy Deift, “Universality for physical and dynamical systems“, International Congress of Mathematicians, Vol. I, 125–152, Eur. Math. Soc., Zürich, 2007.
- Brian Hayes, “The spectrum of Riemannium“, American Scientist, 2003.
- Dan Rockmore, “Stalking the Riemann hypothesis”, Pantheon Books, New York, 2005.
- Terence Tao, “Small samples and the margin of error“, blog post, 2008.
- Terence Tao, “Benford’s law, Zipf’s law, and the Pareto distribution“, blog post, 2009.

7. Footnotes
- Actually, this is an oversimplification: some of the factors mentioned in the text do make a slight difference to the margin of error. For instance, the margin of error when there are a hundred million voters is actually closer to 3.1%, while for a hundred thousand voters it turns out to be about 3.08%. More significantly, the idealised assumptions applied here do not hold in real-world polling. Not every voter is equally likely to be polled; for instance, in a telephone poll, voters with telephones clearly have a greater chance of being polled than voters without telephones. Not every person polled will eventually vote. Not every person polled will actually answer the pollster’s questions correctly, or at all. And, if a poll organisation is partisan, it may give favorable polls more publicity than unfavorable polls. All of these factors can widen the margin of error, or bias the result one way or another, although this can often be compensated for by using the correct methodology. On the other hand, the accuracy and bias of a polling organisation can be discerned through the long term record of that organisation’s polls, by yet another application of the law of large numbers. Once one has this information, one can combine the most recent polls from several organisations via a weighted average into what is effectively a single large poll, which in principle has a smaller margin of error and less bias than any individual poll. These meta-analyses of polls, which exploited the universal law of large numbers multiple times, ended up giving among the most accurate predictions of the election. (In the case of Nate Silver’s predictions, this method was also combined with a demographic analysis, for instance using polls from counties with similar demographic features to calibrate each other by a statistical technique known as regression, to increase the accuracy even further.)
- Again, this is an oversimplification; when dealing with statistics that cannot be negative numbers (such as number of car crashes, or human height, but not the profit or loss from a day of trading), then one often has to replace the normal distribution by a slight variant known as the log-normal distribution; when dealing with statistics of a multi-dimensional nature, such as a three-dimensional velocity, then another variant known as the chi-squared distribution may be needed; and so forth.
- Strictly speaking, this clustering behaviour only occurs for a certain subclass of phase transitions known as continuous or second-order phase transitions, which do not involve the additional complication of latent heat.
- The role of child care in mathematical research should not be underestimated. One of my own collaborations, with Emmanuel Candés in the subject of compressed sensing, took place in no small part in the preschool where we dropped off our respective children.

53 comments
Comments feed for this article
15 September, 2010 at 1:00 am
Einfach genial ! « UGroh's Weblog
[…] September 2010 in Allgemeines, Mathematik | Tags: terence Tao über Man muss dieses einfach lesen. Was er als „A second draft ..“ bezeichnet ist mehr als genial. Wie sieht dann erst die […]
15 September, 2010 at 1:11 am
Maya Incaand
Nice job!
15 September, 2010 at 3:15 am
Bo Jacoby
Microscopics:
1. “an infinitesimal fraction of the entire population” could be “a tiny fraction of the entire population” as “infinitesimal” is mathematical jargon and the fraction is actually finite. [Reworded. -T.]
2. “Perhaps the most spectacular instance of this was the predictions of the statistician Nate Silver”. I do not find it spectacular that amongst a huge number of statisticians a few ones are correct by chance. [Well, this would be true if everyone was only guessing the answer to a binary question (Obama or McCain?), but here the record is 49/50 states and 35/35 Senate elections, which is quite difficult to explain as a consequence of survivor bias alone. Of course, the upcoming 2010 midterm elections should provide a good test of Silver’s long term accuracy with these matters, and presumably I will have to update the text to reflect that outcome. – T.]
3. See http://en.wikipedia.org/wiki/Wikipedia:Reference_desk/Mathematics#basic_probability_.2F_stats_question regarding how to predict populations based on perhaps very small samples.
4. “A histogram of the height of adult human males” is “A histogram of the height of 1000 adult human males” ? [Corrected, thanks – T.]
5. “the zeroes seem to “repel” each other”. Zeroes of polynomials always repel each other when the cooefficients are perturbated. The square roots of a random variable which is uniformly distributed inside the unit disk, are close to the rim. [Yes, though this doesn’t fully explain the amazing fit between the zeta zero spacings and the random matrix predictions in Fig 22. I’m not sure how to raise this point without the text becoming more technical, though. -T]
Macroscopics: Very nice article. Thank you.
15 September, 2010 at 4:31 am
Johan
“A homogeneous bloc of (say) affluent white urban voters, or a mix of voters of all incomes, races, and backgrounds? ”
This might be a slightly confusing formulation. If the voters are all affluent whites the error will be low, but some people might take it to mean that if you sample only white affluent voters, by choice or chance, the error bars will still be low even if there are other kinds of voters.
[Reworded slightly. Actually, the margin of error of a poll (which measures the deviation of the poll result from the actual electoral result) is indeed independent of how homogeneous the voter population is, except in the very extreme case where the population is so homogeneous that it votes at something like 99% or more for one candidate instead of another. -T.]
The upper part of figure 3 is also confusing because of lack of explanation. 50% of what? [Also reworded – T.]
15 September, 2010 at 4:42 am
MCapel
Very nice article!
I have a question about Benford’s law: the probability that a number begins with the digits 3, 1, 4 is log(1+1/314), right? Does it means, that a number with an infinite number of digits (not equal to 0) is impossible to found in “real life”?
[Well, yes, it is quite unlikely for a given statistic to begin with a specific three-digit number, such as 314 – but on the other hand, there are 900 different three-digit combinations that a statistic could have as its leading digits, and the total probability still adds up to 1. In the infinite limit, each individual infinite string of digits has a zero probability of coming up, but there are an infinite number (in fact, an uncountable number) of such strings, so this is not incompatible with the basic axiom of probability that the total probability must always be equal to 1. – T.]
15 September, 2010 at 6:21 am
Phil
“There was the same uncertainty at the state level: while many states were considered safe for one candidate or the other, at least a dozen states were considered “in play”, and which could conceivably go either way.”
“Which” is presumably a typo here.
[Corrected, thanks. -T.]
15 September, 2010 at 6:43 am
Allen K.
These effects can be compensated for to some extent by the proper methodology, but some poll organisations are more careful about this than others.
I think “less careful” makes more sense. (And “more careful” makes less sense.)
Unless you snarkily meant that some are more careful to downplay the polls they don’t like, in which case I approve.
[Reworded to be more neutral in tone – T.]
our respective children
I’m pretty sure that not many readers would have inferred that, if you and Candes had children in common, that you would principally encounter one another at preschool. But it’s good to be clear about these things.
15 September, 2010 at 7:30 am
Tony Vladusich
Reads quite nicely! Figure 3 seems to imply a relationship between the law of large numbers and the central limit theorem. If true, is this something worth mentioning? [Added a comment to this effect – T.]
The fragments below all contain minor typos or word omissions:
a site percolation model on a hexagonal lattice, in which each hexagon (or site) is an abstraction of an atom or molecule is randomly placed one of two states
These laws seem arise in almost every mathematical model
but the internal structure of larger nuclei are so complex …(should read “structures”)
known as the (non-trivial)zeroes
”What will we talk about?” is (first quotation mark is back-to-front)
Montgomery begin to explain his recent results
[Corrected, thanks – T.]
15 September, 2010 at 8:15 am
temur
There seems to be a typo in the second paragraph after the two election maps:
One of the remarkable thing about the law of large numbers it is that it is universal. [Corrected, thanks. -T.]
15 September, 2010 at 8:40 am
James
Dear Terry,
What type of laptop do you use?
15 September, 2010 at 9:57 am
Michelle
can you include a brief example of positive vs negative statistics, as you do with multi-dimensional cases. [The daily profits and losses at Citigroup were intended as an example of a signed statistic; reworded to emphasise this. -T]
you start referring to the zeta function without explicitly defining it, would that be helpful or just confusing? [Added a note that the precise definition of zeta is not necessary to follow the article. – T.]
great article!
15 September, 2010 at 10:27 am
windfarmmusic
A fun read! The images are a great addition and I’m very impressed by how you manage to reference so many different kinds of science in one article.
My two cents regarding ‘hooks’ etc. follow:
While leading with Nate Silver’s success story is a pretty good way to start, that story is well-known and, more generally, political polling is familiar to most people; even if they don’t understand the math, the idea that these polls ‘work’ to a certain degree isn’t as compelling as it might be .
I question that hook because perhaps you’ve got a much better lead already in the article! Specifically, I’m referring to the narrative about Dyson and Montgomery. This is an excellent lead for several reasons:
It puts a human face on the story.
It’s a very literal, easy-to-grasp manifestation of universality – the same idea showing up in two seemingly disparate fields! Even the experts didn’t see it coming! Wow!
It conveys the sense of wonder, discovery, epiphany, and fruitful collaboration that people find compelling (and relatable to) in writing about science that they don’t understand directly. The reader might not understand random matrix theory, or even have heard of it, but they can certainly relate to the joy of finding an unseen connection, of the joy of productive work with someone else.
The best part from a narrative perspective is your author’s note that you had a parallel experience! This is absolute gold . It humanizes you, the author, it makes the whole thing instantly more relatable to most readers, it’s a fascinating insight into the way scientific discovery and human interaction are linked, etc. etc.
15 September, 2010 at 2:09 pm
Blake Stacey
I’m not so sure about this paragraph:
100 degrees Celsius at one atmosphere is not a critical point of H20; 374 degrees and 218 atmospheres is. You don’t see critical opalescence when boiling water on the stove.
[Ah, you caught me out here. I was trying to sweep the two-parameter nature of the phase diagram under the rug to simplify things, but you’re right, this leads to a misleadingly oversimplified picture. I’ve reworded somewhat, though I still want to avoid getting overly technical regarding this point, especially since how many of the toy models, e.g. percolation and Ising type models, have only one key parameter rather than two
, as they are modeling first-order phase transitions rather than second-order ones. – T.]15 September, 2010 at 2:25 pm
Blake Stacey
I like the rewording!
There’s so much interesting history and so many lovely technicalities in this subject, it’s hard to stop talking about them. But, I agree: they’d really be a distraction in this piece.
15 September, 2010 at 2:40 pm
Blake Stacey
The Ising model without applied magnetic field has one dimensionless parameter (the ratio of coupling energy to thermal energy) but its phase transition at is second-order.
15 September, 2010 at 2:47 pm
Blake Stacey
. . . or are we defining “order” in two different ways? E.g., “a second-order transition is where a line of first-order transitions stops” versus using the discontinuities in the free energy or its derivatives.
[Hmm, it’s only after you pointed this out to me that I realised that I did not quite have the right definition of order in a phase transition. Sorry for any confusion. – T]
15 September, 2010 at 3:28 pm
Miguel Lacruz
Dear Terry,
Searching in the Wikipedia, the latin motto in your title also has some classical reminiscences of universality, e.g. when Virgil describes the blending of colors into one as color est e pluribus unus.
All my best,
Miguel
15 September, 2010 at 3:59 pm
Giampiero Campa
I liked really a lot the second part, let’s say from chapter 3 on. The intro is great too. However, as a first impression, I have found the first part perhaps a little too long and wordy. I am afraid that with so many details the reader could miss the main points that you are trying to make and just quit right away.
I’d like to second Johan comment above. I would actually remove that paragraph.
15 September, 2010 at 4:33 pm
anon
i just read the voting part, it was interesting but can be shortened slightly may be. One suggestion though for the intro…before launching into the entire 2008 story, you could use a short paragraph saying many laws of maths are universal, one example being LLN. and then may be say LLN concerns, number of times a coin lands heads or number of mornings it will rain etc. and then say a nice application of LLN is exit polls….
[Added a short description of the LLN. Not sure where to cut the first section though without losing some of the larger structure – T.]
17 September, 2010 at 10:58 am
anon
The place to cut or reduce could be the discussion starting from “The above discussion was an oversimplification for several reasons” to “technique known as regression, to increase the accuracy even further.” Oversimplification is fine for a popular article if it helps to keep the flow easy. This applies more generally, you have tried to be very careful at some places pointing technical caveats in parenthesis. If you really want to be that careful you could say it in one line at the end of the article that some minor simplifications have been made etc….
[I’ve started moving some of the caveats and side remarks to footnotes. Will keep working on this aspect of the text. – T.]
15 September, 2010 at 11:16 pm
Ionica
Wow, you improved the text in so many ways! The sections are well-chosen and I like the quotes at the beginning of each one. The images are also great, I love the living histogram. It is also very nice how you keep emphasizing things we do not know and current research (without going into the technicalities).
Some small remarks:
* I think the first section is great for drawing non-mathematical readers in, though I second the commenters who suggest it might be shortened a bit.
* In the second section it would be good to add Zipf’s law predictions in the figures (as you did for Benford’s law). You might also consider adding a rudimentary bell shape in the histograms for the CLT.
* The beginning of the third section was the hardest for me to read. I am afraid this might be a drop-out point for some readers. Maybe you could put one of the images earlier, or give an example to motivate people to keep reading.
* In section 4 you should remind people (briefly) of the definition of prime numbers. [Done – T.]
16 September, 2010 at 6:04 am
Scott McKuen
“does not have not enough degrees of freedom” – two uses of “not” [Corrected, thanks – T.]
I’ve gotten a lot of enjoyment from both versions of this article – as you said, they are really different. Definitely this one has a breezier tone and is friendlier to the lay reader, and I think it’s better for the stated purpose. That said, the first version is the one that makes me want to read more about random matrix theory….
16 September, 2010 at 12:16 pm
Raghu Raghavan
Should you not mention the renormalization group that revolutionized the understanding of universality in physics, and has such a nice dynamical systems picture? [Added a brief note, though I wish to avoid technical details in this article. -T]
16 September, 2010 at 4:47 pm
anon
very nice article….the part about resonance was not very clear to me. also may be you should consider explaining the term “distribution” somewhere, its used quite often. last paragraph “the simple systems that can be analyzed using the fundamental laws of nature” not really clear what you mean, may be I missed an earlier reference to simple systems?
17 September, 2010 at 9:34 am
Terence Tao
Thanks for all the feedback! I will try to incorporate the feedback to the draft over time, though I may hold off on major reorganisation until later (but I am unlikely to try to rewrite the article from scratch a third time…). I will also probably err on the side of adding material for now, rather than deleting it, as deletion is relatively easy to accomplish later.
17 September, 2010 at 11:11 am
Julie Rehmeyer
Writing for the public is pretty interesting, isn’t it? Certainly keeps me on my toes.
Here are some comments on the first three sections. I should be able to get you more later.
Huge improvement, and I like your lead.
You need a new fourth paragraph. Instead of jumping into the mathematics, you need to tell the reader what it all adds up to and give them a sense of what’s to come, and do it in a way that’s going to entice them to keep reading to find out the details. This is what journalists call the “nut graph,” giving readers the nut of the story.
Do more of the kind of thing you do in the lead. When you discuss the central limit theorem, get us there through a well-told example. Benford’s Law is a rich source of compelling examples, of course. I also think you should introduce Zipf’s Law in a more dramatic fashion — it’s pretty amazing that such a phenomenon could be so widespread and yet so poorly understood mathematically. I also think that could lead into the discussion of phase transitions nicely: Hey look, here’s an area at the cutting edge of math research where we also don’t understand how universality comes about!
17 September, 2010 at 2:37 pm
Aaron Sterling
You need a new fourth paragraph. Instead of jumping into the mathematics, you need to tell the reader what it all adds up to and give them a sense of what’s to come, and do it in a way that’s going to entice them to keep reading to find out the details.
I agree, and I also believe examples of the strong law of large numbers should precede the formal statement of it. This is more important than “normal” because “if one flips” and “if one selects” is a standoffish style, so the text as is will jar a lot of readers into a sudden “oh I’m in math class again” mode. One possible strengthening: have a specific human being the reader can identify with conducting the random experiments, instead of/before abstracting out to the generic “one.”
If I might suggest a general principle: use words to paint a picture of an allegorical representation of the concept. Parables, Aesop’s fables. A good example of this principle applied to mathematical exposition is Feynman’s story of the mother, the child and the 28 blocks, which he used in his third lecture on the character of physical law. (Video three here: http://research.microsoft.com/apps/tools/tuva/index.html#data=4|84edf183-7993-4b5b-9050-7ea34f236045|| )
18 September, 2010 at 10:26 pm
Grad Student
I liked your first draft, but this one is much better and more fun to read, even though I am familiar enough with the field to have understood the previous one just the same.
For us more technical folks, it would be nice if you could post separately the academic papers that you mention without citing in the popular article, so that we can take a look at them ourselves.
A typo:
“This convergence arises not because there of any “low-level” or “microscopic” connection…”
It seems like the word “there” should be removed. [Corrected, thanks – T.]
19 September, 2010 at 12:56 am
rebelJinn
Shouldn’t
“other materials become electrical conductors at some temperatures and insulators in others. ”
be
“other materials become electrical conductors at some temperatures and insulators at others. “? [Corrected, thanks – T.]
29 September, 2010 at 4:27 am
עדכונים: מתמטיים | ניימן 3.0
[…] קצת על מתמטיקה בלי הפרטים הטכניים – תעיפו מבט בטיוטה של טרנס טאו על תיאוריות אוניברסליות. מדובר בתיאוריות מתמטיות כלליות שנכונות לכל נושא […]
30 September, 2010 at 7:59 am
Wiskundemeisjes » Blog Archive » Levende histogrammen
[…] ontdekte deze mooie foto’s dankzij Terence Tao’s (zeer aan te bevelen) artikel over universaliteit. Kennen jullie meer voorbeelden van mensen die grafieken uitbeelden? « Slangen en […]
1 October, 2010 at 8:13 am
Christian S. Perone
Great thanks for that man ! A very nice reading, keep going !!
1 October, 2010 at 7:30 pm
AGT
Nate Silver’s three part (blog) series “The Uncanny Accuracy of Polling Averages” on nytimes.com ties in nicely with this piece.
I especially liked the bit where he says “…it’s tempting to think of each Senate race as its own little unique snowflake. But the polling has provided a reliable guide in the vast majority of races. It is not enough for a race to be unique: it has to be unique in a way that renders the polling much less accurate than it ordinarily would be. If you think you’ve encountered such a case, you should be prepared to make a strenuous argument for it.”
It is amazing how robust some predictions in the face of uncertainty are.
3 October, 2010 at 6:46 am
Mio
Fat tails in price distribution are ubiquitous in all and any kinds of assets, not just those composed of other, more atomic, assets. Anyway, wouldn’t an asset composed of correlated assets with Gaussian price distribution, have a Gaussian price distribution? The remarkable phenomenon is that the fat tailness of individual assets survives when they are combined in a portfolio, instead of becoming Gaussian, the fact that is “explained” by the stability of Levy distribution. Thanks for the article.
7 January, 2011 at 8:27 am
carcar
Why don’t you upload it on arxiv? It would make reading easier.
Of course, the blog version is useful anyway (it allows comments).
26 January, 2011 at 11:23 am
Quora
In what conditions would you expect a power-law distribution curve to emerge?…
The basic reason is that the power law is one of two (!) possible kinds of distributions we can get when we look at the “top few” outcomes of a lot of random draws. Since cities are the largest human settlements, we shouldn’t be too surprised to see…
29 January, 2011 at 7:53 am
Universality « What’s new
[…] undergraduate, I gave a fairly non-technical talk on the universality phenomenon, based on this blog article of mine on the same topic. It was a quite light and informal affair, and this is reflected in the talk slides (which, in […]
4 February, 2011 at 6:33 am
Letture e suoni per il sabato – 6 Febbraio 2010 | Se me lo dicevi prima
[…] (medaglia Fields a 21 anni) e i contenuti del suo blog sono di solito incomprensibili ai più. A second draft of a non-technical article on universality fa parte dei rari post per il grand public, ben scritti e godibili a chiunque sia abbastanza […]
16 February, 2011 at 4:17 pm
Links « Epanechnikov's Blog
[…] A non-technical article on universality (Terry Tao) […]
14 May, 2011 at 7:04 am
Maples on Cohen-Lenstra for matrices with iid entries « Quomodocumque
[…] Universality of random matrix laws is a very active and fast-moving topic, but Maples’ result is the first universality result for p-adic matrices that I know of. More generally, I think there’s a lot to be gained by understanding how well the richly developed theory of random large real and complex matrices carries over to the p-adic case. […]
19 October, 2011 at 3:46 am
human mathematics
First of all Terry, I think it’s admirable that you rewrote the article from scratch.
In my opinion, a strong title and first paragraph require the most time and attention. Second and third paragraph less so, and thereafter you’ve more or less won the reader’s time.
With that in mind here are a few suggestions for the start:
* countless — does that mean anything? Could be omitted / avoided.
Maybe start with a question.
*Even more* concrete language than “campaign rhetoric, the media coverage, rumors, personal impressions of the candidates, or from discussing politics with friends and colleagues”
* For example give some examples of the incendiary rhetoric, especially sound bites that demonstrate your overall point.
The quotes are good, though perhaps a little too close together.
Consider this opening.
The above is no Chuck Palahniuk. But what I’m trying to do differently than your opening is:
* be more punchy
* use concrete examples
* the examples allude to other things that were said around election time
* set up something big which I claim I will knock down.
Roughly speaking … converge to a certain number, known as the expected outcome of that random method.
* work from specific to general
* short sentences
* you don’t need to be precise
One more thought: the subtitle doesn’t distinguish your article from hundreds of other non-technical math articles on any topic. Specificity, senses, hooks.
Good luck!
16 December, 2012 at 10:56 pm
TBA
Great article! But Fig 4 confused me because it doesn’t look Gaussian (it isn’t very symmetrical). Wouldn’t a histogram of accidental deaths per month be Poisson distributed?
17 December, 2012 at 8:54 am
Terence Tao
The Poisson distribution asymptotically approaches a Gaussian distribution when the expectation parameter becomes large (this is a variant of the central limit theorem). (It is true, though, that the Poisson distribution would be a slightly better approximation in this case, though for the purposes of this non-technical talk I prefer not to highlight these subtle distinctions.)
6 February, 2013 at 2:19 pm
The Spectral Beauty of Universality | REALscience
[…] mathematics awareness month in 2010 Tao describes universality in the distribution of prime numbers. He says, “The prime numbers are distributed in an irregular fashion through the integers; […]
1 March, 2013 at 4:57 pm
The Universal laws behind growth patterns, or what Tetris can teach us about coffee stains | Empirical Zeal
[…] You can think of universality classes like a sort of mathematical filing cabinet. Say that you’re studying how ice particles clunk together on your windshield. If the rate at which the skyline widens matches the blue curve above, ice clunking is in the same universality class as Tetris. If it matches the purple curve, then ice clunking is in the same universality class as Sticky Tetris. Now, there are other universality classes out there, and not all growth processes can be neatly filed into a universality class. But the key point is that many seemingly different physical systems, when analyzed mathematically, show identical patterns of growth. This slightly mysterious tendency for very different things to behave in very similar ways is the essence of universality. […]
8 March, 2013 at 6:02 am
Dan S
Very interesting article – thanks. I was glad to see the “When it fails” section, because sometimes articles can become too “just-so”.
Two bits of feedback on the writing: (1) the length will be difficult for some generalist readers – consider serialising perhaps; (2) please don’t use phrases like “the details are too technical to give here” – it foregrounds the reader’s incompetence. There are better ways to let us know you’re skipping over something which you regard as part of the “proof”…
1 May, 2014 at 10:54 am
Universality and Random Matrices | Vuhavan's Blog
[…] weeks ago, I gave a survey talk at IAS on random matrices. The topic is the Universality Phenomenon (click on the link to see an informal discussion by my coauthor T. Tao) which has been one of […]
13 October, 2014 at 9:31 am
Terence Tao
A translated version of this talk (in German), illustrated with photographs and other imagery by Jochem Berlemann, has now been published at http://www.e-enterprise.de/Mathematik-Programm/Komplexitaet-und-Universalitaet.html
26 December, 2014 at 9:17 am
Random matrix theory (RMT) in finance | CL-UAT
[…] For a good first treatment see this non-technical article by Terence Tao. […]
4 June, 2015 at 11:23 am
Universality and orthogonal polynomials | Nonempty Spaces
[…] plot for Gadolinium 156 nucleus. (The source of the image is https://terrytao.wordpress.com/2010/09/14/a-second-draft-of-a-non-technical-article-on-universality/ , but the original one can be found in the article C. Coceva and M. Stefanon, Experimental aspects […]
22 October, 2017 at 8:52 am
Universality and orthogonal polynomials – Tivadar Danka
[…] plot for Gadolinium 156 nucleus. (The source of the image is https://terrytao.wordpress.com/2010/09/14/a-second-draft-of-a-non-technical-article-on-universality/ , but the original one can be found in the article C. Coceva and M. Stefanon, Experimental aspects […]
26 April, 2021 at 2:40 am
Why do my Stack Exchange reps follow a power law? ~ Mathematics ~ mathubs.com
[…] there a universality argument for why this power law might […]
1 March, 2022 at 4:29 pm
Random matrix theory (RMT) in finance - Finance Money
[…] For a good first treatment see this non-technical article by Terence Tao. […]